Trading Education Platform SystemSubscribe for Free
START HERE

What is R?

R is the amount you decide to lose if a trade goes wrong. It lets us compare a trade on Bitcoin with a trade on a small coin: both are measured against what was at stake.

The idea

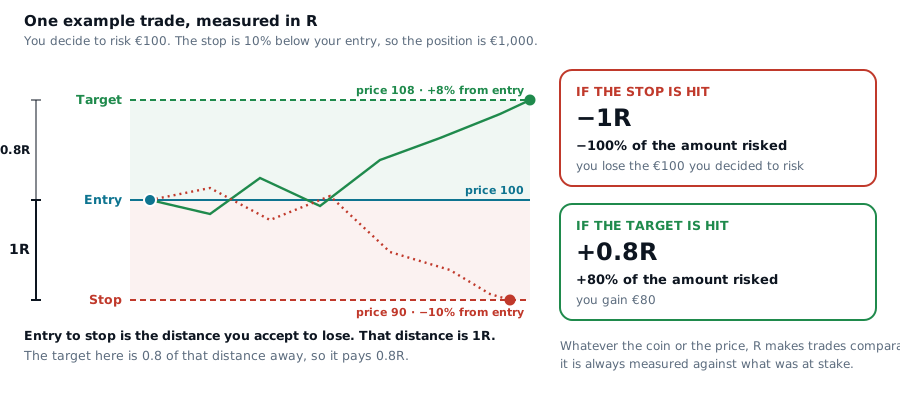
One trade, measured in R

A trade with entry, stop and target, measured in R

Before entering, you pick a stop: the price at which you accept being wrong. The distance from entry to stop is 1R. If the stop is hit you lose 1R. If price travels twice that distance in your favour you gain 2R.

Three ways to read the same number

R, percent and euros

ResultIn RAs % of the amount riskedIf you risk €100
Stopped out
-1R
-100%
-€100
Half a stop
-0.5R
-50%
-€50
Break-even
0R
0%
€0
Small gain
+0.5R
+50%
+€50
Target at 2x the risk
+2R
+200%
+€200

On these pages every result is shown in R and as a percentage of the amount risked. A pattern that averages +0.05R per trade makes +5% of what you risk, on average: €5 per trade if you risk €100. A pattern that averages -0.10R loses 10% of what you risk: €10 per trade. This is not the same as the percentage change of your account or of the coin price.

Words used in the tests

Short glossary

Average per trade+0.05RThe mean result of all trades, after costs and funding. The number to look at.
nTradesHow many trades the number comes from. Small n means a shaky average.
95% rangeMargin of errorA range that would contain the true average 95 times in 100 if we repeated the study. If it includes zero, we cannot tell the result from luck.
Random entriesThe yardstick1,000 runs that enter at random times with the same stops and targets. They show what costs and stops alone do.
Held-back periodThe final examThe most recent two years, kept apart from the earlier periods used to look at the rule.
ATRTypical candle sizeAverage True Range: how far a coin normally moves in one candle. We measure shapes and stops in ATR so coins can be compared.
FundingPerpetual feePerpetual futures charge or pay a rate every 8 hours. We use the real historical rates.
Why it matters

A high win rate is not a good result

A rule that wins 7 trades in 10 can still lose money if the wins are small and the losses large. R puts size and frequency in one number. To break even you need a win rate of loss / (win + loss): with 2R wins and 1R losses, one trade in three. Each pattern page shows its break-even win rate next to the real one.

Education only, not investment advice.